Theory
Lets's start with necessary theoryAll connectivity troubleshooting is around 3 protocols which will help us to find if connectivity works. We will not discuss if application/server/deamon running on the port works correctly.
Those protocol are ICMP, TCP and UDP and there understanding is crucial to correctly work with testing tools and scripts and understand results.
We however will cover just necessary aspects
ICMP
Internet Control Message Protocol is useful to find out if routing works correctly. Among a lot of messages we will concentrate on 3 echo request, echo reply, and TTL exceeded.Echo request and reply
Is pair of messages they are used in ping you send Echo request and the destination devices shall reply with echo reply.TTL Exceeded
Each packet (not only ICMP but also TCP and UDP) have set TTL (time to live) as packet is routed through the network each device doing routing(firewall, router, computer, switch with routing module) will inspect the packet and check TTL if it's higher then 0 it will decrease it by one and send packet further based on routing table. If it's 0 it shall send the ICMP message TTL exceed to source of the packet this behavior is utilized by traceroute.TCP
Transmission Control Protocol is used to transfer data. For us is important to understand it connection oriented. So there is something we call session. Session begins with so called 3 way hand shake which if successful establish the session. Then is data transfer. And then connection is closed.For easier understanding you can imagine it as call.You call, somebody answers it. For each question you ask you got "some" answer, if you don't understand you ask to repeat and before hangup you say goodbye.
To specify session TCP use ports 0 - 65535 so the session is identified by source IP, source Port and destination IP and destination Port. Source port is assigned dynamically and is usually higher then 1024. Destination port depends on setting of service on destination servers, but there are standard ports which are reserved for specific services. For example port 80 for http, 443 for https, 22 SSH, 21 FTP, 25 SMTP...
3 way handshake
Client starts connection with SYN packet server reply with SYN-ACK and client sends ACK. That's how connection is established.If server doesn't want or cannot accept the connection it shall send RST packet instead of SYN-ACK.
Most of the testing utilities will show message "Connection refused" or "Connection closed by foriegn host"
Joke to easier remember :-)
- Can I tell you TCP joke?
+ Yes. please tell me TCP joke.
- OK. I will tell you TCP joke.
UDP
User Datagram Protocol similar as TCP is used for transfer of data also use ports i same way as TCP. The difference is that UDP is connection less. You send data and you don't care if it's received or if it's in correct order.
Again analogy for easier understanding. You can imagine it as pigeon post. You send message and you don't know if it was received or not and you don't even care.
Joke to easier remember :-)
- I would tell you UDP joke, but I'm not sure if you would get it.
1) is port open at destination(is there some service listening)?
- try connect locally (telnet, nc)
- check open ports (netstat, lsof, ps)
- kill the service running and set dummy listener (nc)
- check firewall allows the traffic (if windows is part of Domain it's possible that even you disable firewall it's still active because of domain policy)
2) is routing working correctly?
- try ping
- do the traceroute
3) are all firewalls allowing traffic?
- do tcp or udp based traceroute
- run packet capture (tcpdump, wireshark) and test connectivity, check for RST packet
- check for possible asymetric routing.
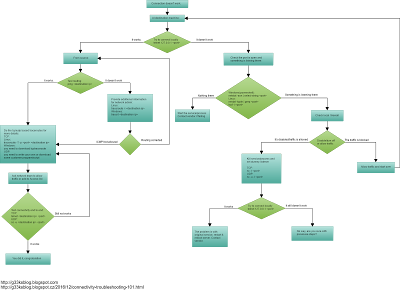
Below you have flowchart which help you the troubleshooting path:
Linux/Windows
On both platforms ping s work the same only difference is that on linux by default it run continues ping and you need to stop it by CTRL-C and on windows it do just 4 probes.
You can change the behavior by using options, read the help of those for more details.
Examples:
Traceroute features TTL field in packet, it start be sending probe where TTL = 1, hence first router shall respond that TTL expires. second probe with TTL = 2 so second router respond TTL expired, 3rd probe TTL=3 and 3rd router will respond ... and so one it keep increasing TTL till it reach destination or limit of probes, which by default is 30.
Linux/windows:
On linux it's traceroute and it use UDP on high ports it keeps increasing the UDP port along with TTL which makes it denied by almost any firewall.
The solution is easy, you can use -I option to make it use ICMP instead. However you have to run it with root rights. (Same tcp traceroute).
To omit the problem with ever increasing UDP port I wrote simple script which use possibility to start at custom UDP port and start from certain hop, hence it going in loop and for each hop it's doin traceroute with one probe starting from custom hop and using custom port. It's bit of scratching right ear with left hand, but it works.
Here you can find my shell script for UDP Trace with not increasing UDP port: udptrace
Windows version, tracert is using ICMP by default.
Examples:
Here you can see one succesful traceroute (it's from linux using -I, hence use ICMP as probe packets). Those lines containing * * * are router or firewalls, which are set not to answer with TTL.
Now let's say network admin do the change routing change on ffm-b1-link.telia.net and by mistake enter wrong route and create routing loop below is how the traceroute will look like
In case above you can clearly identify the problem, however your traceroute might just "stop in the midle" and then traffic need to be checked hop by hop by network admins, and traceroute is just the hint for them.
The problems which produce output below can be:
Firewall or access-list is blocking the traffic
Devices are set not to send ICMP error codes. (In this case the traffic might go further then we see)
It's avalable on and work same for linux and windows enviroment, in Windows you just need to "add
feature: Telnet client". In linux you need to install it, it's usually part of main repository.
Examples:
This is how succesfull connection looks like
This is what you will get if the connectivity is blocked by firewall (and firewall is talkative) or nothing is listening on that port.
It can be used as dummy listener on port or bound the command or script to port, to create simple server.
It can be used as a client as well.
It operates over UDP and TCP.
In linux you need to install it it's usually in main repository. For windows you need to download compiled version for eaxample from here (https://eternallybored.org/misc/netcat/)
Or for creating "dummy" TCP server / listener you can use powershell script like this https://github.com/kindljiri/connectivity-testing/blob/master/PortListener.ps1
Below are examples of creating dummy listener and connecting to it in order to test end to end connectivity.
Examples:
First we set on my raspberry pi netcat to listen on port 160 TCP
Second we connect from my turris router to my raspberry pi to port 160 TCP and write the test message you see same message shows on the Raspberry as well, which means connection works perfectly.
Now we do same think but with UDP port 162.
TCPDump is avalable on linux, on windows it's better to use wireshark, even though you can find and download tcpdump for windows as well.
You shall learn few basic filters and combine them:
tcpdump host - to filter just traffic to and from specific device
tcpdump port - to filter traffic on specific port
Below are two examples:
1) is succesfull connection to port 80 at host 10.0.0.39 in output I added few empty lines to separated so you better see.
First 3 packets are 3 way handshare we discussed in theory part.
Next two is data and ack that is was recieved. (in longer connections you'll see the traffic coming both ways)
Last 3 packets are closeing of connection.
2) is connection refused when trying to connect to port 82 at host 10.0.039. (there is nothing listening there).
You can see that destination device refuse connection with RST packet.
Again analogy for easier understanding. You can imagine it as pigeon post. You send message and you don't know if it was received or not and you don't even care.
Joke to easier remember :-)
- I would tell you UDP joke, but I'm not sure if you would get it.
General Process of troubleshooting
There are few steps to troubleshoot and get to quickly to conclusion point 1) you can do on your own, if you have access to destination machine, points 2) and 3) needs to be resolved by network admin using info from traceroutes.
- try connect locally (telnet, nc)
- check open ports (netstat, lsof, ps)
- kill the service running and set dummy listener (nc)
- check firewall allows the traffic (if windows is part of Domain it's possible that even you disable firewall it's still active because of domain policy)
2) is routing working correctly?
- try ping
- do the traceroute
3) are all firewalls allowing traffic?
- do tcp or udp based traceroute
- run packet capture (tcpdump, wireshark) and test connectivity, check for RST packet
- check for possible asymetric routing.
Below you have flowchart which help you the troubleshooting path:

Tools
Ping
Ping use ICMP echo request/reply. It send request and wait for reply or other message. If none is received it will show timeout.Linux/Windows
On both platforms ping s work the same only difference is that on linux by default it run continues ping and you need to stop it by CTRL-C and on windows it do just 4 probes.
You can change the behavior by using options, read the help of those for more details.
Examples:
PS C:\Users\j.kindl> ping 192.168.0.1
Pinging 192.168.0.1 with 32 bytes of data:
Reply from 192.168.0.1: bytes=32 time=5ms TTL=254
Reply from 192.168.0.1: bytes=32 time=26ms TTL=254
Reply from 192.168.0.1: bytes=32 time=26ms TTL=254
Reply from 192.168.0.1: bytes=32 time=1ms TTL=254

Ping statistics for 192.168.0.1:
    Packets: Sent = 4, Received = 4, Lost = 0 (0% loss),
Approximate round trip times in milli-seconds:
    Minimum = 1ms, Maximum = 26ms, Average = 14ms
PS C:\Users\j.kindl> ping 192.168.0.3

Pinging 192.168.0.3 with 32 bytes of data:
Reply from 192.168.0.10: Destination host unreachable.
Reply from 192.168.0.10: Destination host unreachable.
Reply from 192.168.0.10: Destination host unreachable.
Reply from 192.168.0.10: Destination host unreachable.

Ping statistics for 192.168.0.3:
    Packets: Sent = 4, Received = 4, Lost = 0 (0% loss),
traceroute/tracert
Traceroute features TTL field in packet, it start be sending probe where TTL = 1, hence first router shall respond that TTL expires. second probe with TTL = 2 so second router respond TTL expired, 3rd probe TTL=3 and 3rd router will respond ... and so one it keep increasing TTL till it reach destination or limit of probes, which by default is 30.
Linux/windows:
On linux it's traceroute and it use UDP on high ports it keeps increasing the UDP port along with TTL which makes it denied by almost any firewall.
The solution is easy, you can use -I option to make it use ICMP instead. However you have to run it with root rights. (Same tcp traceroute).
To omit the problem with ever increasing UDP port I wrote simple script which use possibility to start at custom UDP port and start from certain hop, hence it going in loop and for each hop it's doin traceroute with one probe starting from custom hop and using custom port. It's bit of scratching right ear with left hand, but it works.
Here you can find my shell script for UDP Trace with not increasing UDP port: udptrace
Windows version, tracert is using ICMP by default.
Examples:
Here you can see one succesful traceroute (it's from linux using -I, hence use ICMP as probe packets). Those lines containing * * * are router or firewalls, which are set not to answer with TTL.
root@raspberrypi:/home/pi# traceroute -I lifehacker.com
traceroute to lifehacker.com (151.101.1.34), 30 hops max, 60 byte packets
 1  10.0.0.1 (10.0.0.1)  0.368 ms  0.513 ms *
 2  * * *
 3  * * *
 4  * * *
 5  * * *
 6  * 124.197.broadband16.iol.cz (90.183.197.124)  30.275 ms  29.408 ms
 7  * * *
 8  * * *
 9  * * *
10  * * *
11  * * ffm-bb4-link.telia.net (62.115.113.114)  48.533 ms
12  ffm-b1-link.telia.net (62.115.116.160)  48.519 ms * *
13  * * *
14  * * *
15  * * *
16  * * *
17  * 151.101.1.34 (151.101.1.34)  47.523 ms *
Now let's say network admin do the change routing change on ffm-b1-link.telia.net and by mistake enter wrong route and create routing loop below is how the traceroute will look like
root@raspberrypi:/home/pi# traceroute -I lifehacker.com
traceroute to lifehacker.com (151.101.1.34), 30 hops max, 60 byte packets
 1  10.0.0.1 (10.0.0.1)  0.368 ms  0.513 ms *
 2  * * *
 3  * * *
 4  * * *
 5  * * *
 6  * 124.197.broadband16.iol.cz (90.183.197.124)  30.275 ms  29.408 ms
 7  * * *
 8  * * *
 9  * * *
10  * * *
11  * * ffm-bb4-link.telia.net (62.115.113.114)  48.533 ms
12  ffm-b1-link.telia.net (62.115.116.160)  48.519 ms * *
13  * * ffm-bb4-link.telia.net (62.115.113.114)  48.533 ms
14  ffm-b1-link.telia.net (62.115.116.160)  48.519 ms * *
15  * * ffm-bb4-link.telia.net (62.115.113.114)  48.533 ms
16  ffm-b1-link.telia.net (62.115.116.160)  48.519 ms * *
17  * * ffm-bb4-link.telia.net (62.115.113.114)  48.533 ms
18  ffm-b1-link.telia.net (62.115.116.160)  48.519 ms * *
...
29  * * ffm-bb4-link.telia.net (62.115.113.114)  48.533 ms
30  ffm-b1-link.telia.net (62.115.116.160)  48.519 ms * *
In case above you can clearly identify the problem, however your traceroute might just "stop in the midle" and then traffic need to be checked hop by hop by network admins, and traceroute is just the hint for them.
The problems which produce output below can be:
Firewall or access-list is blocking the traffic
Devices are set not to send ICMP error codes. (In this case the traffic might go further then we see)
root@raspberrypi:/home/pi# traceroute -I lifehacker.com
traceroute to lifehacker.com (151.101.1.34), 30 hops max, 60 byte packets
 1  10.0.0.1 (10.0.0.1)  0.368 ms  0.513 ms *
 2  * * *
 3  * * *
 4  * * *
 5  * * *
 6  * 124.197.broadband16.iol.cz (90.183.197.124)  30.275 ms  29.408 ms
 7  * * *
 8  * * *
 9  * * *
10  * * *
11  * * ffm-bb4-link.telia.net (62.115.113.114)  48.533 ms
12  ffm-b1-link.telia.net (62.115.116.160)  48.519 ms * *
13  * * *
14  * * *
15  * * *
...
30  * * *
nslookup
Use to check your DNS is working. Even though it's not related with connectivity for some applications it's important that name resolution works.
Examples:
root@NSA320:~# nslookup judo.local
Server: 10.0.0.1
Address 1: 10.0.0.1
nslookup: can't resolve 'judo.local'
Examples:
root@NSA320:~# nslookup judo.local
Server: 10.0.0.1
Address 1: 10.0.0.1
nslookup: can't resolve 'judo.local'
telnet
Telnet is TCP client, and it can be used to test connectivity to any TCP Port. If the server we connect to is not using encryption, it can be even used to test higher protocol.It's avalable on and work same for linux and windows enviroment, in Windows you just need to "add
feature: Telnet client". In linux you need to install it, it's usually part of main repository.
Examples:
This is how succesfull connection looks like
root@raspberrypi:/home/pi# telnet 10.0.0.34 80
Trying 10.0.0.34...
Connected to 10.0.0.34.
Escape character is '^]'.
^]
telnet> quit
Connection closed.
This is what you will get if the connectivity is blocked by firewall (and firewall is talkative) or nothing is listening on that port.
root@raspberrypi:/home/pi# telnet 10.0.0.34 8080
Trying 10.0.0.34...
telnet: Unable to connect to remote host: Connection refused
nc/netcat
Netcat or nc is networking Swiss knife.It can be used as dummy listener on port or bound the command or script to port, to create simple server.
It can be used as a client as well.
It operates over UDP and TCP.
In linux you need to install it it's usually in main repository. For windows you need to download compiled version for eaxample from here (https://eternallybored.org/misc/netcat/)
Or for creating "dummy" TCP server / listener you can use powershell script like this https://github.com/kindljiri/connectivity-testing/blob/master/PortListener.ps1
Below are examples of creating dummy listener and connecting to it in order to test end to end connectivity.
Examples:
First we set on my raspberry pi netcat to listen on port 160 TCP
root@raspberrypi:/home/pi# nc -l 160
hello raspi from turris
root@raspberrypi:/home/pi#
Second we connect from my turris router to my raspberry pi to port 160 TCP and write the test message you see same message shows on the Raspberry as well, which means connection works perfectly.
root@turris:~# telnet 10.0.0.37 160
hello raspi from turris
^]

Console escape. Commands are:
 l      go to line mode
 c      go to character mode
 z      suspend telnet
 e      exit telnet

e

root@turris:~#
Now we do same think but with UDP port 162.
root@raspberrypi:/home/pi# nc -u -l 162

hello raspi from NSA320

^C
root@raspberrypi:/home/pi#
root@NSA320:~# nc -u 10.0.0.37 162
hello raspi from NSA320
^Cpunt!

root@NSA320:~#
tcpdump
TCPDump is tool for capturing packets. So you can see exactly what's going on.TCPDump is avalable on linux, on windows it's better to use wireshark, even though you can find and download tcpdump for windows as well.
You shall learn few basic filters and combine them:
tcpdump host
tcpdump port
Below are two examples:
1) is succesfull connection to port 80 at host 10.0.0.39 in output I added few empty lines to separated so you better see.
First 3 packets are 3 way handshare we discussed in theory part.
Next two is data and ack that is was recieved. (in longer connections you'll see the traffic coming both ways)
Last 3 packets are closeing of connection.
root@raspberrypi:/home/pi# tcpdump -n host 10.0.0.39
tcpdump: verbose output suppressed, use -v or -vv for full protocol decode
listening on eth0, link-type EN10MB (Ethernet), capture size 65535 bytes

18:57:12.524518 IP 10.0.0.37.48472 > 10.0.0.39.80: Flags [S], seq 1769757482, win 29200, options [mss 1460,sackOK,TS val 63103684 ecr 0,nop,wscale 6], length 0
18:57:12.528361 IP 10.0.0.39.80 > 10.0.0.37.48472: Flags [S.], seq 2965564486, ack 1769757483, win 8688, options [mss 1460,nop,wscale 0,nop,nop,sackOK,nop,nop,TS val 631341150 ecr 63103684], length 0
18:57:12.528754 IP 10.0.0.37.48472 > 10.0.0.39.80: Flags [.], ack 1, win 457, options [nop,nop,TS val 63103684 ecr 631341150], length 0

18:57:22.141319 IP 10.0.0.37.48472 > 10.0.0.39.80: Flags [P.], seq 1:11, ack 1, win 457, options [nop,nop,TS val 63104646 ecr 631341150], length 10
18:57:22.144151 IP 10.0.0.39.80 > 10.0.0.37.48472: Flags [.], ack 11, win 8678, options [nop,nop,TS val 631350800 ecr 63104646], length 0

18:57:22.152834 IP 10.0.0.39.80 > 10.0.0.37.48472: Flags [FP.], seq 1, ack 11, win 8678, options [nop,nop,TS val 631350800 ecr 63104646], length 0
18:57:22.153440 IP 10.0.0.37.48472 > 10.0.0.39.80: Flags [F.], seq 11, ack 2, win 457, options [nop,nop,TS val 63104647 ecr 631350800], length 0
18:57:22.156770 IP 10.0.0.39.80 > 10.0.0.37.48472: Flags [.], ack 12, win 8688, options [nop,nop,TS val 631350800 ecr 63104647], length 0
2) is connection refused when trying to connect to port 82 at host 10.0.039. (there is nothing listening there).
You can see that destination device refuse connection with RST packet.
root@raspberrypi:/home/pi# tcpdump -n host 10.0.0.39
tcpdump: verbose output suppressed, use -v or -vv for full protocol decode
listening on eth0, link-type EN10MB (Ethernet), capture size 65535 bytes
19:00:02.370831 IP 10.0.0.37.44112 > 10.0.0.39.82: Flags [S], seq 303448752, win 29200, options [mss 1460,sackOK,TS val 63120669 ecr 0,nop,wscale 6], length 0
19:00:02.374124 IP 10.0.0.39.82 > 10.0.0.37.44112: Flags [R.], seq 0, ack 303448753, win 0, length 0
wireshark
As tcpdump wireshark is a packet capturing and analysing tool. For connectivity troubleshooting it's Must to learn the use filters.
Below are few usefull examples:
ip.addr == 10.0.0.39
udp.port == 162
Below is same example as in tcpdump above.

netstat
Netstat will show all kinds of network statistics, as what connections are open, or which are waiting to be closed, how is routing set and for us most important is what ports are open (it also say the PID of process listening on the port so you can kill it if you need to replace it with dummy listener for troubleshooting purpose.) Netstat is default for both Linux and Windows and can be in connection with grep(Linux), select-string (Windows/power shell)
Windows:
netstat -aon
netstat -aon | select-string
Linux:
netstat -tupln
netstat -tupln | grep
PS C:\Users\j.kindl> netstat -aon

Active Connections

  Proto  Local Address          Foreign Address        State           PID
  TCP    0.0.0.0:80             0.0.0.0:0              LISTENING       4
  TCP    0.0.0.0:135            0.0.0.0:0              LISTENING       880
...
  TCP    10.0.0.31:139          0.0.0.0:0              LISTENING       4
  TCP    10.0.0.31:59245        0.0.0.0:0              LISTENING       5676
  TCP    10.0.0.31:62273        149.154.167.91:443     ESTABLISHED     5624
...
  TCP    10.0.0.31:63069        31.13.93.3:443         ESTABLISHED     3092
  TCP    10.0.0.31:63085        52.222.148.86:443      CLOSE_WAIT      9936
  TCP    10.0.0.31:63116        173.194.76.189:443     ESTABLISHED     3092
  TCP    10.0.0.31:63578        52.45.152.106:443      CLOSE_WAIT      9936
  TCP    10.0.0.31:63593        108.160.172.225:443    CLOSE_WAIT      9936
  TCP    10.0.0.31:63596        2.21.74.9:80           TIME_WAIT       0
...
  TCP    127.0.0.1:63054        127.0.0.1:63053        ESTABLISHED     9936
  TCP    192.168.71.1:139       0.0.0.0:0              LISTENING       4
...
  TCP    [::]:49667             [::]:0                 LISTENING       1832
  TCP    [::]:49668             [::]:0                 LISTENING       2108
  TCP    [::]:49670             [::]:0                 LISTENING       732
  TCP    [::]:49681             [::]:0                 LISTENING       724
  UDP    0.0.0.0:443            *:*                                    4560
  UDP    0.0.0.0:3702           *:*                                    696
...
  UDP    0.0.0.0:58363          *:*                                    1832
  UDP    0.0.0.0:60778          *:*                                    1164
  UDP    0.0.0.0:62458          *:*                                    4560
  UDP    10.0.0.31:137          *:*                                    4
  UDP    10.0.0.31:138          *:*                                    4
  UDP    10.0.0.31:1900         *:*                                    3356
  UDP    10.0.0.31:2177         *:*                                    3356
  UDP    10.0.0.31:53304        *:*                                    3356
  UDP    10.0.0.31:59245        *:*                                    5676
  UDP    127.0.0.1:1900         *:*                                    3356
...
  UDP    192.168.136.1:2177     *:*                                    3356
  UDP    192.168.136.1:53302    *:*                                    3356
  UDP    [::]:3702              *:*                                    3356
...
  UDP    [::1]:1900             *:*                                    3356
  UDP    [::1]:53301            *:*                                    3356
No comments:
Post a Comment